Linear and non-linear systems
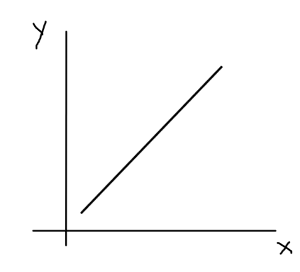
In mathematics, linear systems are systems that can be modeled using a linear combination (Ax + By + C = 0) of the variables involved and can be represented through a straight line on a graph. The slope in such cases is constant i.e. the rate of change of the dependent variable with respect to the independent variable is same.

Linear system
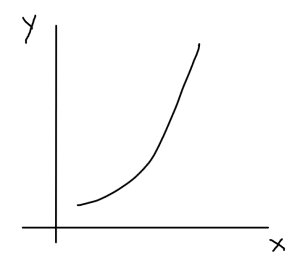
Nonlinear systems, on the other hand, represent everything that can’t be modeled using a linear combination of variables and are represented using curves on graphs. In such cases, the rate of change of the dependent variable with respect to the independent variable can vary.

Non-linear system
Why is understanding this important?
We are predominantly wired to think linearly. This causes us to make poor decisions because when we encounter situations in our day-to-day lives that can be modeled as nonlinear systems, we make the mistake of thinking linearly.
This brilliant article by HBR on the same topic has an example to illustrate this blindsightedness. Here is an excerpt from the same –
You manage two models, an SUV that gets 10 miles to the gallon and a sedan that gets 20. The fleet has equal numbers of each, and all the cars travel 10,000 miles a year. You have enough capital to replace one model with more-fuel-efficient vehicles to lower operational costs and help meet sustainability goals.
Which upgrade is better?
A. Replacing the 10 MPG vehicles with 20 MPG vehicles
B. Replacing the 20 MPG vehicles with 50 MPG vehicles
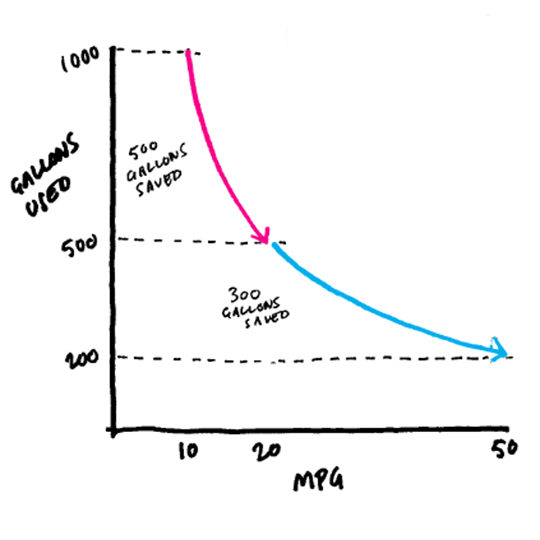
Intuitively, option B seems more impressive—an increase of 30 MPG is a lot larger than a 10 MPG one. And the percentage increase is greater, too. But B is not the better deal. In fact, it’s not even close. Let’s compare.
| GALLONS USED PER 10,000 MILES | |||
| CURRENT | AFTER UPGRADE | SAVINGS | |
| A. | 1000 (@10 MPG) | 500 (@20 MPG) | 500 |
| B. | 500 (@20 MPG) | 200 (@50 MPG) | 300 |

The relationship between gallons used and miles per gallon is nonlinear when intuitively it doesn’t seem so.
What can be done?
Mapping relationships on paper while decision-making helps. The thing to do here is to not let the System 1 of our brain (in Daniel Kahneman’s parlance) that is responsible for intuitive and quick responses take charge of important, irreversible or high-stake decisions. Rather, the motive should be to understand the variables and see how they relate to the outcome.
If there is data, then the task is seemingly easier but if not then exhaustively thinking about instances where this relationship has played out and how it has played out can help in seeing whether it is linear or nonlinear.
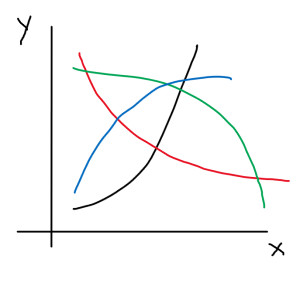
What is also critical is to understand the kind of nonlinear relationship that the system is exhibiting. There are different ways in which we can model nonlinear systems as shown by the graph below.
This will simplify the picture and enable clear thinking to tackle the respective problem.

Types of non-linear relationships